The economic dimension of construction waste: global figures
The economic impact of reducing and managing construction waste directly affects project profitability across every market. The European Union generates 374 million tonnes per year of construction and demolition waste (CDW, Eurostat 2020), equivalent to 35% of all solid waste produced. In the United States, the EPA estimated CDW generation at 600 million tonnes in 2018, more than twice the volume of municipal solid waste. The total cost of CDW management in the EU is estimated at 2,000-5,000 million euros per year (Deloitte, 2017), encompassing transport to processing facilities, sorting and processing, landfill disposal, and administrative compliance. For a typical residential building project, waste-related costs represent between 3% and 8% of the material execution budget, with values typically ranging from 15 to 40 EUR/m2 of constructed floor area. These figures are not marginal overheads; they constitute a significant cost centre that can be substantially reduced through systematic management and prevention strategies.
The cost structure of CDW management follows a consistent pattern across European markets, though absolute values differ sharply between countries. Transport accounts for 30-40% of the total cost, at rates of 0.10-0.25 EUR/kg depending on distance to the processing plant. Landfill disposal fees represent 25-40% of total costs, but the variation between countries is dramatic: from 10-15 EUR/tonne in southern European nations to 80-120 EUR/tonne in Denmark and 100-150 EUR/tonne in the United Kingdom. Processing at plant adds 15-20%, while administrative management — permits, documentation, traceability records — accounts for the remaining 10-15%. This geographic cost differential explains recycling rate disparities with remarkable precision: where landfill is cheap, the economic motivation to recycle remains low; where landfill taxation raises disposal costs above the threshold of recycling costs, sorting and recovery become the economically rational choice.
Savings from on-site sorting: data from real projects
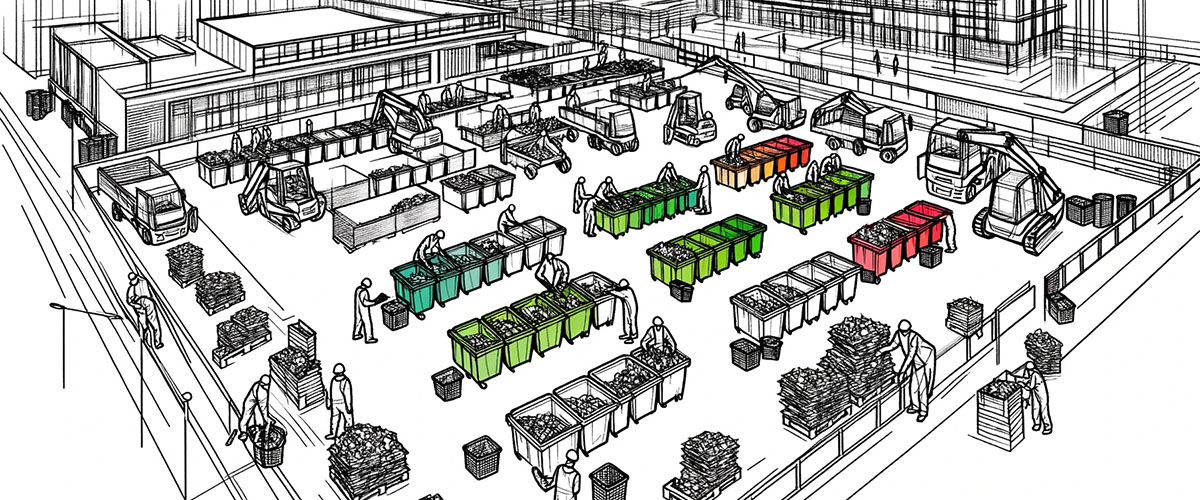
The selective sorting of waste on construction sites — separating concrete, timber, metals, plastics, cardboard, inert mixtures, and hazardous waste into dedicated containers — is the strategy offering the best cost-benefit ratio. Data from WRAP (Waste and Resources Action Programme, UK) across more than 300 projects documents that on-site sorting reduces waste management costs by 30% to 50%. The mechanism is straightforward: sorted waste is accepted at recycling facilities for 10-30 EUR/tonne, compared to 50-150 EUR/tonne for mixed waste. Valuable fractions — ferrous and non-ferrous metals at 80-200 EUR/tonne, clean timber at 5-15 EUR/tonne — generate revenue that partially offsets management costs. The capital expenditure required to install sorting containers on site ranges from 500 to 2,000 EUR per project, an investment that is typically amortised within the first week of construction activity on medium-scale projects exceeding 500 m2 of built floor area.
A well-documented case study illustrates the financial returns at scale: The Edge (Amsterdam, 2015, designed by PLP Architecture for developer OVG Real Estate) — a 40,000 m2 office building that achieved BREEAM Outstanding certification — reached a landfill diversion rate of 95% through on-site sorting into 12 separate waste fractions. The net saving in waste management costs was 180,000 EUR compared to the estimated cost of conventional management with mixed waste sent to landfill, equivalent to 4.5 EUR/m2 of constructed area. In Spain, construction projects managed by Ferrovial Construccion that implement waste management plans with sorting into 5-7 fractions report average savings of 25-35% on the waste management budget line (Ferrovial Sustainability Report, 2022). In the United Kingdom, Skanska's Costain-Skanska JV projects on major infrastructure works have documented diversion rates above 97%, demonstrating that near-zero waste to landfill is achievable even on complex civil engineering projects.
Prevention: designing to generate less waste
Waste prevention — reducing generation at source — delivers an economic impact superior to recycling because it simultaneously avoids the cost of wasted material and the cost of managing that material as waste. Verified prevention strategies include: modular and standardised design, which reduces cuts and offcuts (a BRE study estimated that dimensional coordination to a 300 mm module reduces plasterboard waste by 20-30% and brick waste by 10-15%); off-site prefabrication, which reduces on-site waste by 50-70% compared to traditional construction (Jaillon et al., 2009); BIM for precise quantity take-off, enabling procurement with margins below 3% compared to the customary 10-15% over-ordering; and dry construction systems such as light steel framing and mechanically fixed partitions, which generate waste below 2% of material purchased, compared to 5-15% for wet trades.
The cumulative economic impact is substantial. Material loss in conventional construction ranges between 10% and 15% of all material purchased. For a residential building with a material execution budget of 1,500 EUR/m2, this represents 150-225 EUR/m2 of wasted material — of which 40-60% is avoidable through the strategies outlined above. For a 5,000 m2 building, the potential saving through waste prevention alone is 300,000-675,000 EUR, an order of magnitude greater than the savings achievable through better management of the waste that is generated. This calculation consistently persuades clients and contractors to invest in prevention-first approaches: the return on investment for BIM-enabled quantity optimisation, for example, is typically recovered within the first three months of a major construction project.
Regulatory framework and penalties: the cost of non-compliance
CDW regulation has progressively tightened obligations and penalties across all major construction markets. In Spain, Royal Decree 105/2008 mandates the preparation of a Construction and Demolition Waste Management Plan (PGRCD) for every project with a budget exceeding 75,000 EUR, with compulsory on-site separation when quantities exceed 80 tonnes of concrete, 40 tonnes of timber, 2 tonnes of metals, 1 tonne of glass, or 0.5 tonnes of plastics. Non-compliance can result in penalties of 10,000 to 175,000 EUR for serious infractions or 175,001 to 1,750,000 EUR for very serious infractions under Law 7/2022 on waste. Additionally, a financial guarantee deposit for CDW management, required by many regional authorities, ranges from 11-17 EUR/m2 for new construction and 14-19 EUR/m2 for demolition, refundable only upon demonstrating correct management through certified documentation.
The revised European Waste Directive (2018/851/EU) raised the CDW recovery target to 70%, and the proposed Waste Framework Directive revision (2024) advances toward a mandatory requirement for on-site separation into a minimum of 5 fractions. In England, the Site Waste Management Plans Regulations (now revoked but widely adopted voluntarily) established benchmarks that many large contractors continue to follow. The cost of regulatory compliance is real but consistently lower than the cost of penalties and, critically, lower than the cost of reputational damage and exclusion from public procurement processes that increasingly require certified CDW management as a pre-qualification criterion. The economic impact of reducing and managing construction waste is unequivocally positive: less material purchased, less material managed as waste, lower regulatory risk, and stronger positioning in green certifications and public tenders.
References
- [1]Halving Waste to Landfill: Achieving the Target — Summary Report of Construction WasteWaste and Resources Action Programme.
- [2]Resource Efficient Use of Mixed Wastes: Improving Management of Construction and Demolition Waste — Final ReportEuropean Commission DG Environment / Deloitte.
- [3]Quantifying the waste reduction potential of using prefabrication in building construction in Hong KongWaste Management, 29(1), 309-320.
- [4]Generation of waste by waste category — Construction waste statisticsEuropean Commission / Eurostat.
- [5]Plan Estatal Marco de Gestión de Residuos (PEMAR) 2016-2022: Informe de SeguimientoGobierno de España.
- [6]Completing the Picture: How the Circular Economy Tackles Climate ChangeEllen MacArthur Foundation.

Comments 0
No comments yet. Be the first!
Leave a comment